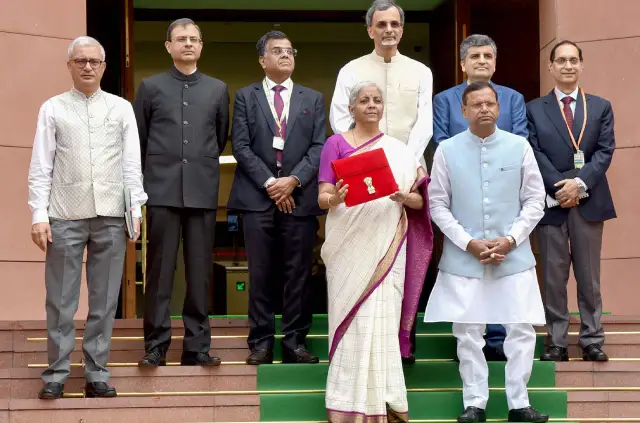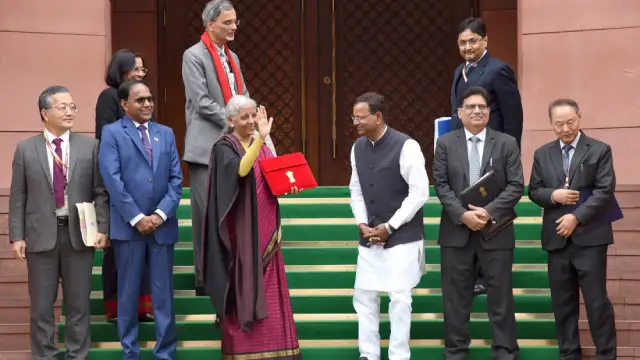
On February 1st, Finance Minister Nirmala Sitharaman unveiled India’s Union Budget 2026-27 to the Parliament. The numbers in Ms Sitharaman’s looked impressive. Total expenditure would reach Rs 53.5 trillion. Capital spending would climb to Rs 12.2 trillion. The fiscal deficit would fall to 4.3% of GDP. Yet beneath these headline figures lies a troubling gap between ambition and action.
The previous day, the government’s own Economic Survey had issued a stark warning. Services, it noted, had done “much of the heavy lifting” for India’s economy. But services alone could not build “durable external and currency stability”. Only goods-based export ecosystems could do that.
What happens to be the Union Budget’s response? To double down on services while offering manufacturing schemes that prize technology over employment.
What makes this a problem for India?
India faces a demographic crossroads.
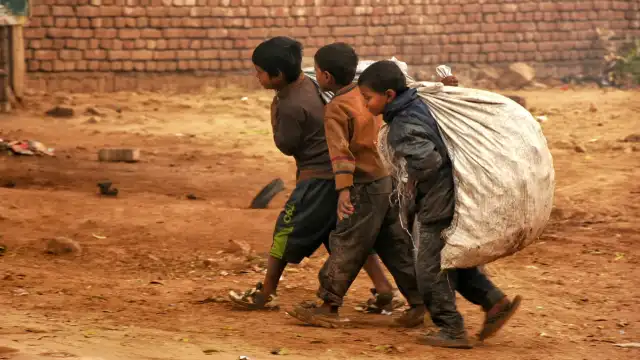
Its working-age population will peak at 1.04bn by 2030. That represents the largest labour force of any major economy. Seven to eight million young Indians enter the workforce each year. They need jobs. Most will not find them in the capital-intensive semiconductor plants and electronics schemes the Union Budget 2026-27 now champions.
India’s Union Budget 2026-27 bets on chips, not shirts
The manufacturing schemes at the heart of this Union Budget 2026-27 reveal a fundamental tension. The India Semiconductor Mission 2.0 receives Rs 400bn. The Electronics Components Manufacturing Scheme gets another Rs 400bn. Both sectors are capital-intensive. Together, they might create 100,000 to 200,000 skilled positions over five years. That sounds meaningful until one considers the scale of India’s employment challenge.
The ILO’s India Employment Report 2024 documented the problem clearly. Between 2000 and 2019, manufacturing output grew by 7.5% annually. Manufacturing employment grew by just 1.7%. Machines replaced workers. Productivity rose. Hiring stagnated.
The Periodic Labour Force Survey for 2023-24 paints a sobering picture. Some 46% of India’s workforce remains in agriculture. Yet farming produces only 17-20% of GDP. A worker outside agriculture is roughly five times more productive. Self-employment accounts for 58% of total employment. Casual labour makes up another 22%. Only 21% of workers hold regular wage jobs. Fully 90% of all employment is informal.
Now, add to this Prime Minister Narendra Modi’s four new Labour Codes. They diminish the scope of secure employment further and turn India into a global hub for gig work.
The Production-Linked Incentive (PLI) schemes promised 6m jobs. After four years, they have delivered 1.26m only. That represents a 21% achievement rate. Textiles remain India’s best hope for labour-intensive manufacturing. The sector employs 45m workers. But it faces automation pressure and stiff competition from Bangladesh and Vietnam, where costs run lower, and relationships with global brands run deeper.
India’s 74.7m micro, small and medium enterprises employ 328m people. They face a liquidity crisis that the Union Budget 2026-27 barely addresses. Delayed payments from large buyers now total Rs 8.1 trillion. The credit gap exceeds Rs 25-30 trillion, according to SIDBI-CRISIL estimates. Against this, the Budget offers a Rs 100bn SME Growth Fund. That addresses 0.3% of the shortfall. India’s MSME credit penetration stands at 14%. Meanwhile, China’s rate reaches 37%, and the USA’s hits 50%.
Which programmes suffer?
List of schemes/programmes where the budget estimates are lesser than the revised estimates of the current financial year
Rural India gambles on an untested replacement for MGNREGA
The Union Budget 2026-27 allocates Rs 1.63 trillion for agriculture, up 28% from last year. Rural development receives Rs 2.73 trillion. But the most significant change involves employment guarantees.
Mr Modi’s penchant for abbreviations, especially those that sound Hindi and Hindu, has made headlines. However, the new one is catastrophic, critics argue.
Viksit Bharat Guarantee for Rozgar and Ajeevika Mission – Gramin (abbreviated as VB-G RAM G) replaces the Mahatma Gandhi National Rural Employment Guarantee Act (MGNREGA).
The new scheme, VB-G RAM G, promises 125 days of work vis-a-vis MGNREGA’s 100 days. However, Mr Modi’s government has made major changes to diminish the benefits of the erstwhile MGNREGA.
VB-G RAM G receives Rs 956.92bn. MGNREGA’s allocation plummets from Rs 860bn to Rs 300bn. On paper, the arithmetic looks problematic. Providing 125 days to 90m job-card households at Rs 356 per day would require Rs 4 trillion. The allocation stands at one-quarter of that sum.
The funding formula also shifts risk to the states. MGNREGA split costs 90:10 between the Union and the States on wages and materials. VB-G RAM G introduces a 60:40 Union-state split.
Many states are already strained under fiscal pressure. Six of the 12 states running unconditional cash transfer schemes now post revenue deficits. This means they won’t be able to afford paying for the VB-G RAM G scheme.
Moreover, Mr Modi’s government has changed the scheme from a demand-driven to a project-driven one. Hence, the rural workers can’t seek work when they need it but have to wait for projects, which will add uncertainty to their lives.
This will further defeat the purpose of the original MGNREGA—to stop rural labour migration. With more rural labour force migrating to urban centres, the infrastructure of Indian cities will face further pressure.
At the same time, the rural labour force has no other option but to migrate en masse.
India’s agricultural yields lag global averages by substantial margins. Rice yields run 30-50% below world averages. Maize trails by roughly half. Soybeans lag the US yields by 60%. Pulses fall short by a third. These gaps constrain rural incomes regardless of the Union Budget allocations.
Technology offers some promise. AgriStack now covers 17 states and 492 districts. It has issued 60m farmer IDs. BharatVISTAAR receives Rs 1.5bn. Yet 86% of Indian farmers work small and marginal holdings averaging just 1.08 hectares. That figure has fallen from 2.28 hectares in 1970-71. Only 18% of rural households use smartphones for farming decisions. The digital divide makes direct-to-farmer technology deployment unrealistic without support from farmer-producer organisations and Common Service Centres.
Where are major expense cuts?
Union schemes where there have been cuts vis-a-vis the last budget
Post-harvest losses devour Rs 1.5 trillion annually. Some 30% of fruits and vegetables spoil before reaching consumers. Cold chain infrastructure remains grossly inadequate. Potatoes claim 70% of India’s cold storage capacity. Perishable produce goes wanting.
India’s fiscal house looks tidy, but states teeter on the edge
The Union’s fiscal trajectory appears disciplined. The deficit has fallen from 5.6% of GDP in the 2023-24 financial year to a targeted 4.3% for 2026-27. Debt-to-GDP should reach 55.6%. The government targets 50% plus or minus one percentage point by 2031. Capital expenditure rises to 4.4% of GDP. S&P upgraded India to BBB in August 2025, its first upgrade in 18 years.
Yet critical risks lurk beneath these numbers. Revenue assumptions look optimistic. Gross tax revenue as a share of GDP actually falls from 11.5% in 2024-25 to 11.2% in 2026-27. GST 2.0 rationalisation could cost Rs 480bn in lost revenue. Disinvestment targets consistently disappoint. The 2025-26 target was Rs 470bn. Achievement reached Rs 338.37bn, a 28% shortfall. The 2026-27 target leaps to Rs 800bn, assuming IDBI Bank stake sales proceed. Record gross borrowings of Rs 17.2 trillion may pressure yields and debt affordability.
The state-level picture looks more troubling. Combined Union-state debt stands at roughly 85% of GDP. States account for 27.5% of GDP in outstanding liabilities, well above the 20% recommended by fiscal responsibility legislation. Unconditional cash transfer schemes now operate in 12 states. They cost Rs 1.68 trillion annually, or 0.5% of GDP. Just two states ran such schemes in 2022-23.
Maharashtra’s Ladki Bahin programme costs Rs 360bn. Karnataka’s Gruha Lakshmi runs to Rs 286.08bn. The Reserve Bank of India’s State Finances Report warned explicitly that a “sharp rise in expenditure on subsidies and cash transfers can cause stress to state finances” and reduce space for productive spending.
Automation races against India’s demographic window
India’s demographic dividend creates urgency. The working-age population share peaks at 68.9% by 2030. But this window coincides with accelerating global automation. The World Economic Forum projects 92m jobs displaced worldwide by 2030. Some 41% of employers plan workforce reductions due to artificial intelligence.
India’s robot density provides a temporary buffer. The country deploys roughly five to seven robots per 10,000 employees. China deploys 470. South Korea deploys 1,012. The global average reaches 162. ILO data suggests developing countries face lower immediate AI displacement risk: 0.4% versus 5.5% in high-income nations.
This buffer is eroding. China doubled its robot density in just four years between 2019 and 2023. Automation scales quickly once it begins.
The Budget’s technology emphasis creates tension with employment goals. The IndiaAI Mission receives Rs 103.72bn over five years. The semiconductor push represents necessary capability-building. But these investments generate limited employment. The government states that AI should “complement human potential rather than replacing it”. That aspiration does not resolve the structural challenge. Capital-intensive technology investments cannot absorb India’s mass labour force.
Evidence of premature deindustrialisation already appears. Manufacturing’s share of GDP has stagnated at 15-17% since 1991. It has never exceeded 20% in independent India’s history. Most Indian states peaked in manufacturing share during the 1990s. Gujarat alone saw manufacturing exceed 20% of state’s GDP. The traditional East Asian manufacturing-led development path may no longer be fully replicable.
Human capital constraints compound the challenge. India ranks 130th on the Human Development Index, with a value of 0.685. That places it in “medium human development”, well behind China at 75th, Vietnam at 115th and Indonesia at 112th. The World Bank’s Human Capital Index scores India at 0.49-0.50. A child born today will become only half as productive as they could be with full health and complete education. China scores 0.65. Vietnam scores 0.69.
Learning poverty, the share of ten-year-olds unable to read and understand a simple text, stands at 56% in India. China’s rate reaches perhaps 15-18%. Sri Lanka manages 15%. Students complete 11 years of schooling but acquire only 7.1 years of actual learning. Child stunting affects 35.5% of Indian children, the world’s highest concentration. Wasting at 18.7-19.3% ranks second-highest globally. India ranks 102nd of 123 countries on the Global Hunger Index, with a “serious” designation.
Budget allocations fall far short of stated targets. Education receives Rs 1.39 trillion against a National Education Policy target of 6% of GDP. The gap runs to roughly 1.4% of GDP, or Rs 4.9 trillion. Health receives Rs 1.05 trillion against a National Health Policy target of 2.5% of GDP. The gap runs to roughly 0.9% of GDP, or Rs 3.2 trillion.
Vietnam built its manufacturing success on decades of universal primary education investment, spending 0.62% of GDP on preschool alone. Strong government commitment and accountability mechanisms supported this effort. India’s neglect of compulsory primary education left its population in low-productivity agriculture while competitors built skilled manufacturing workforces.
Trade contradictions undermine India’s China+1 opportunity
India faces a paradoxical trade situation. The US has imposed 50% tariffs on Indian goods: a 25% baseline plus a 25% secondary tariff for Russian oil purchases. This rate exceeds China’s 47%. The supposed beneficiary of supply chain diversification now faces higher barriers than the country firms seek to leave.
Structural competitiveness gaps persist despite improvements. Logistics costs have fallen to 7.97% of GDP from 8.84% in 2022-23. That approach developed economic benchmarks. But deeper constraints remain.
India’s average tariffs reach 18%, nearly double Vietnam‘s 9.6% and China’s 7.5%. These duties raise input costs for export manufacturing. Labour productivity trails Vietnamese performance despite lower wages. Unit labour costs can favour China for complex manufacturing. Global value chain participation has declined. Backward linkages in manufacturing fell from roughly 35% in 2012 to 23% in 2016. Foreign direct investment flows declined 43% in 2023-24, while Vietnam saw a 32% increase. India’s share in network products, including electronics, computers, telecommunications and vehicles, amounts to just 10% of merchandise exports. China, Japan and South Korea each hit 50%.
The India-EU Free Trade Agreement, concluded in January 2026, represents a significant positive. The deal eliminates tariffs on 96% of EU goods exports. India wins substantial concessions on textiles, leather, gems and engineering goods. But this cannot offset the US tariff disadvantage or resolve fundamental competitiveness gaps.
Policy contradictions explain why India has not captured more of the China+1 shift.
High import tariffs undermine export competitiveness.
Make in India protectionism conflicts with global value chain integration requirements.
Withdrawal from the Regional Comprehensive Economic Partnership left India outside Asia’s largest trade bloc.
Restrictions on Chinese investment since 2020 have limited technology transfer. The PLI schemes provide value but are not a substitute for a stable, predictable business environment, according to trade experts.
The Economic Survey explicitly warned that services exports, while “creditable and macro-stabilising”, “are not a substitute for the goods-based export ecosystems that ultimately underpin durable external and currency stability”. Services now contribute 56.4% of gross value added, the highest share ever. Services exports grew 13.6% annually since 2020. Merchandise exports managed just 6.4%.
India’s Union Budget 2026-27 responds to this warning by intensifying support for services.
IT safe harbours introduce a common 15.5% margin with raised thresholds.
Medical tourism receives support for five regional hubs and training of 150,000 caregivers.
Animation, visual effects, gaming and comics get content creator labs in 15,000 schools and 500 colleges.
Data centres receive tax holidays extending to 2047.
These represent reasonable investments in India’s comparative advantage. But they fail to address the Survey’s concern about manufacturing’s institutional and currency-stabilising role.
Services employ only roughly 5m in IT and business process outsourcing out of more than 450m workers. Growth is capital and skill-intensive, limiting broad-based employment absorption.
The Survey noted that manufacturing provides longer contracts, larger-scale employment and more predictable foreign exchange earnings.
The Budget’s services emphasis cannot replicate these characteristics.
Incrementalism when transformation is required
Union Budget 2026-27 represents competent fiscal management. It delivers continued infrastructure investment and modest deficit reduction. It does not represent the structural transformation the Economic Survey identifies as essential.
The fundamental misalignments are clear. The employment crisis requires labour-intensive manufacturing. The Union Budget’s manufacturing schemes are capital-intensive. The medium, small and micro enterprises’ (MSME) credit gap exceeds Rs 25 trillion.
The Union Budget 2026-27 offers Rs 100bn for the MSME sector.
Human capital deficits require education and health spending of 8.5% of GDP combined. Actual spending runs to approximately 6.2%.
Trade competitiveness requires lower tariffs and deeper global value chain integration. Tariff policy remains protectionist. FDI inflows have been declining.
India’s demographic dividend peaks around 2030. That creates a shrinking window. The Union Budget’s incremental approach maintains fiscal stability. It is insufficient to capture this window before global automation fundamentally alters manufacturing’s employment potential.
The Economic Survey’s warnings about services not substituting for manufacturing, about informal employment dominance and about global value chain marginalisation find inadequate response in a Budget that prioritises fiscal discipline over structural transformation.
India may achieve fiscal responsibility at the cost of demographic opportunity foregone.
East Post is an independent geopolitical analysis portal covering South Asia and global power dynamics for international audiences. Views expressed are analytical and do not constitute endorsement of any state or non-state actor.
Join our channels on Telegram and WhatsApp to receive geopolitical updates, videos and more.